Sessions
Browse individual user sessions, view their event timelines, and inspect device, location, and traffic source details.
The Sessions page lists every session your signal has recorded. Use it to understand individual user journeys and debug unexpected behaviour. Navigate to it via Analytics → Sessions.
Toolbar
-
Date range — Today, Yesterday, Last 7 days, Last 30 days, or Custom Range
-
Refresh — reload data manually
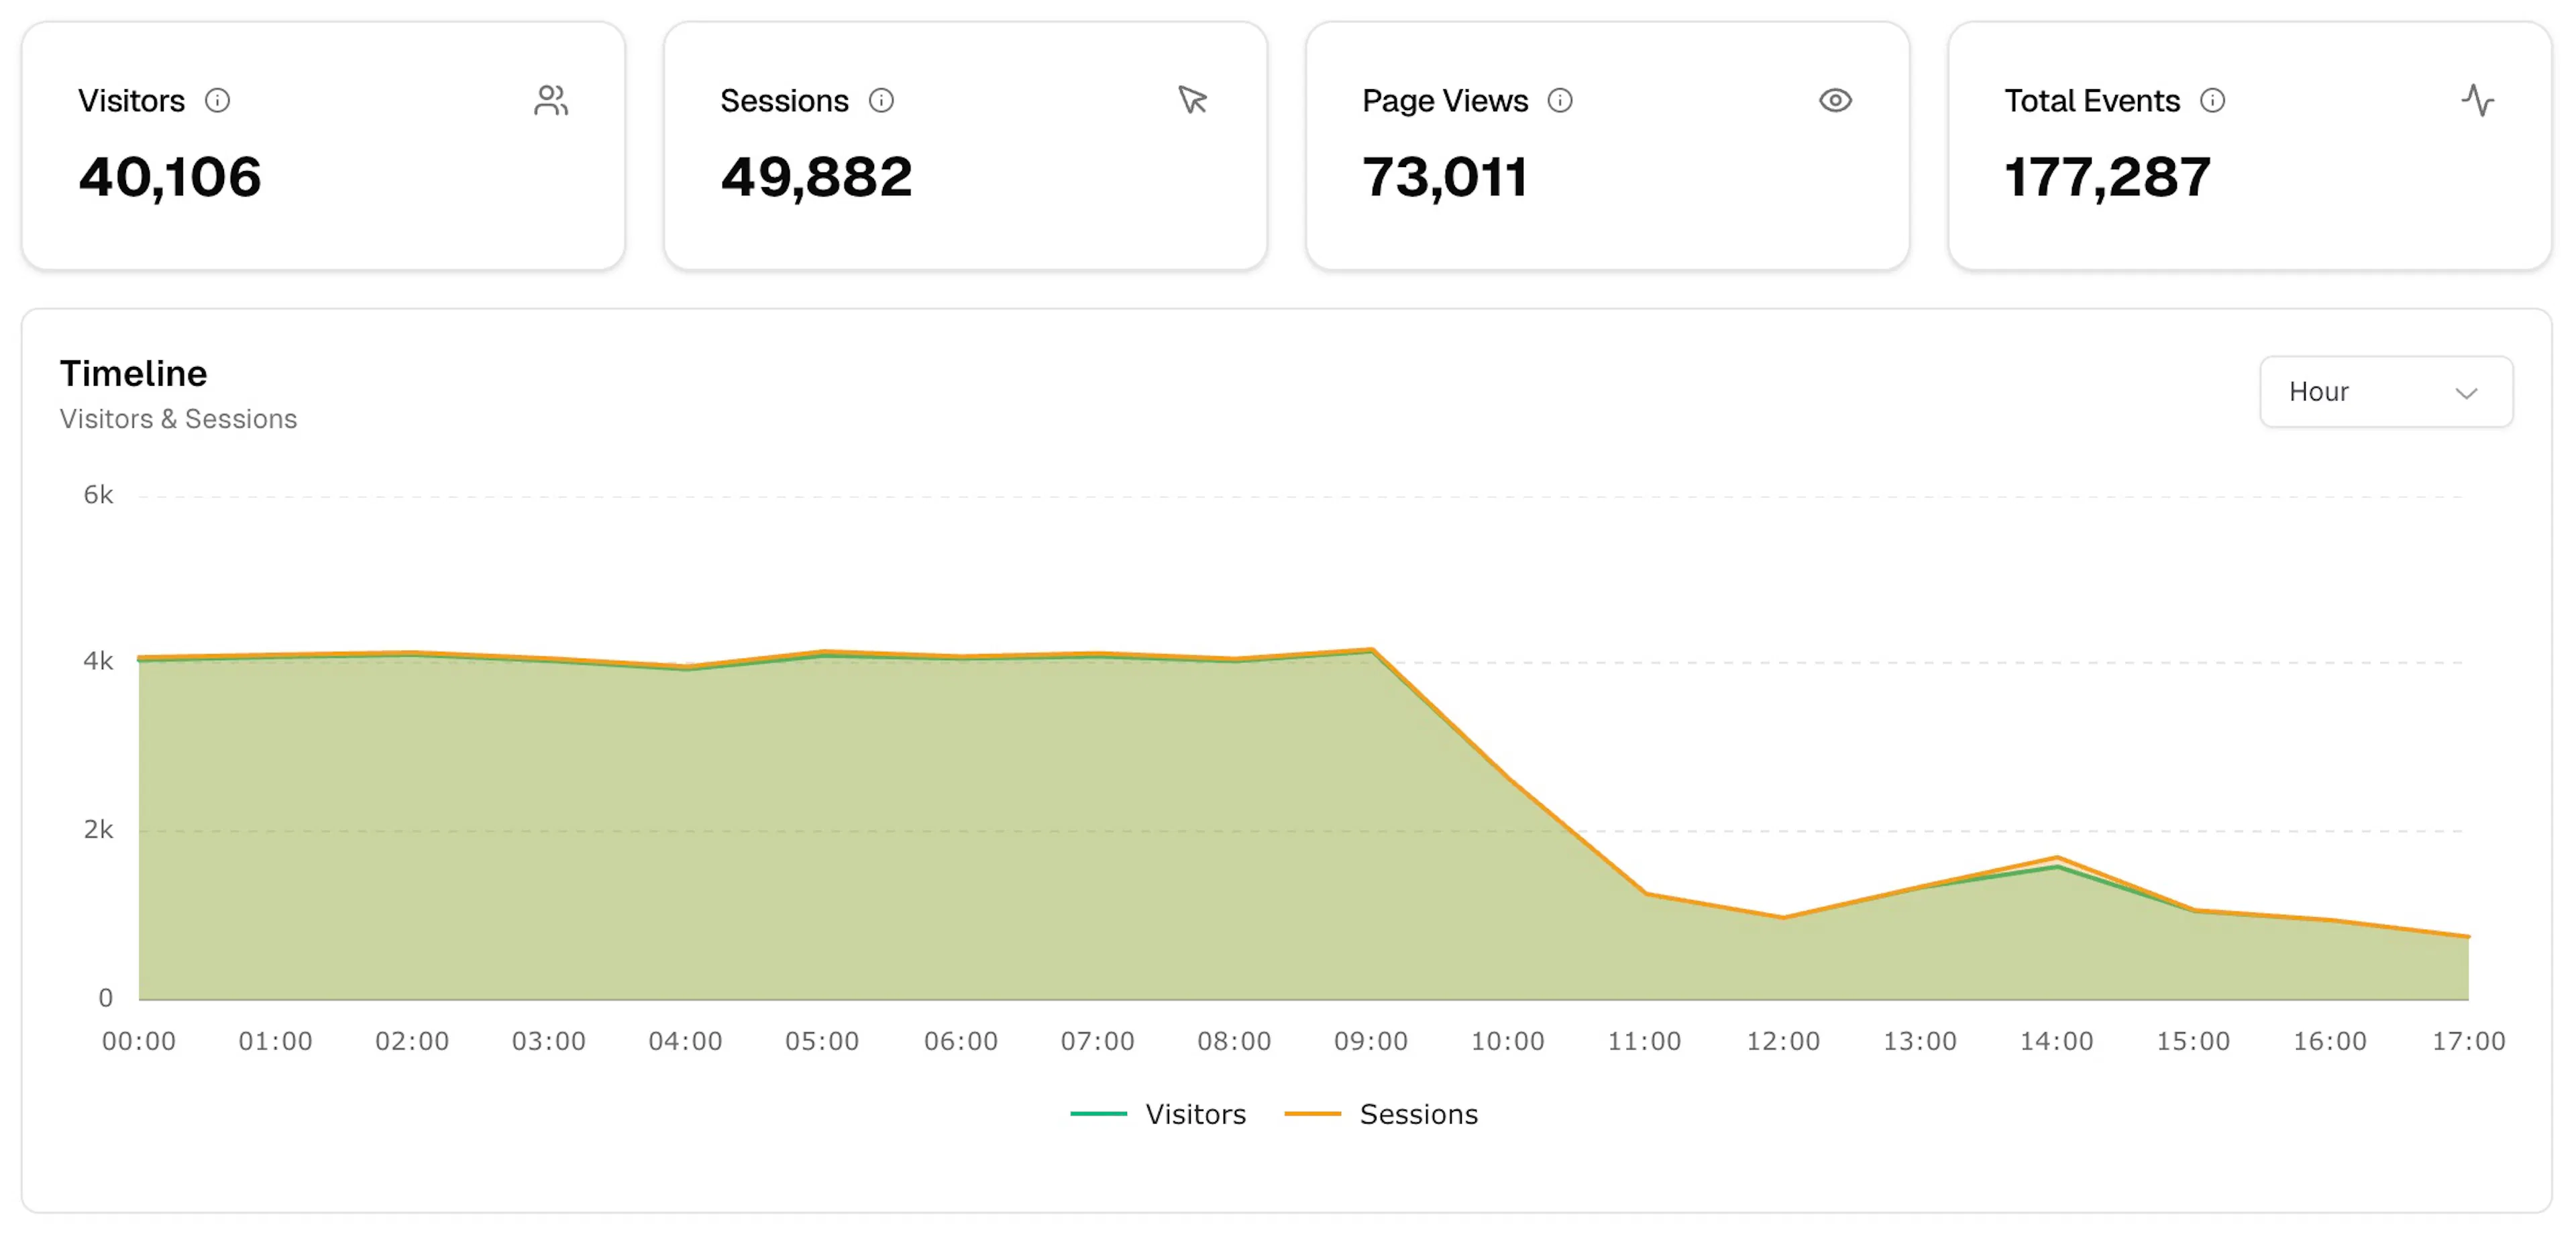
Summary metrics
Four cards mirror the Overview dashboard:
| Metric | Description |
|---|---|
| Visitors | Unique visitors in the selected period |
| Sessions | Total sessions |
| Page Views | Total page view events |
| Total Events | All events across all types |
Timeline chart
An area chart plotting Visitors and Sessions over time. Use the Hour dropdown to adjust the granularity.
Session Logs
A detailed table of individual sessions. Drag a column header to the top bar to group by that dimension.
Columns
| Column | Description |
|---|---|
| Timestamp | When the session started |
| Session ID | Unique session identifier (truncated) |
| Device Info | Country flag, browser, OS, and device type icons |
| Views | Number of page views in the session |
| Events | Total events in the session |
| Source | Traffic source (e.g. Google, Instagram) |
| Landing Page | Entry page → exit page (e.g. /blog → /blog) |
Use the Filters panel on the right edge to narrow results. Use Columns to show or hide fields. Click CSV to export.
Session detail panel
Click any row to open a slide-out panel with two tabs.
Timeline tab
Shows a chronological list of every event in the session, with the event name, timestamp, and page path. A summary at the top shows the total event count broken down by event type.
Session Info tab
Session
-
Session ID
-
User ID
-
Start and End timestamps
-
Event count
-
Page Views count
-
Hostname
Device & Location
-
Device type
-
Browser
-
Operating System
-
Location (country and city)
Source
-
Source
-
Medium
-
Referrer