Campaigns
Measure revenue and conversions by traffic source, medium, and campaign.
The Campaigns page breaks down your revenue and conversions by traffic source. Use it to understand which channels and campaigns are driving the most value. Navigate to it via Analytics → Campaigns.
Toolbar
-
Date range — Today, Yesterday, Last 7 days, Last 30 days, or Custom Range
-
Compare to — toggle to enable period-over-period comparison
Summary metrics
Four cards show totals for the selected period:
| Metric | Description |
|---|---|
| Visitors | Unique visitors |
| Sessions | Total sessions |
| Revenue | Total attributed revenue |
| Conversions | Total conversion events |
Time-series chart
A time-series chart shows how your traffic and conversions evolve over the selected period. Use the controls above the chart to configure it:
| Control | Options | Default |
|---|---|---|
| Interval | minute, hour, day, week, month | hour |
| Breakdown | source, medium, campaign | source |
| Metric | sessions, conversions | sessions |
Each line on the chart represents one value of the selected breakdown (for example, one source) plotted against the chosen metric.
When Compare to is enabled, the chart also overlays the comparison period using the same interval, breakdown, and metric so you can read both ranges side by side.
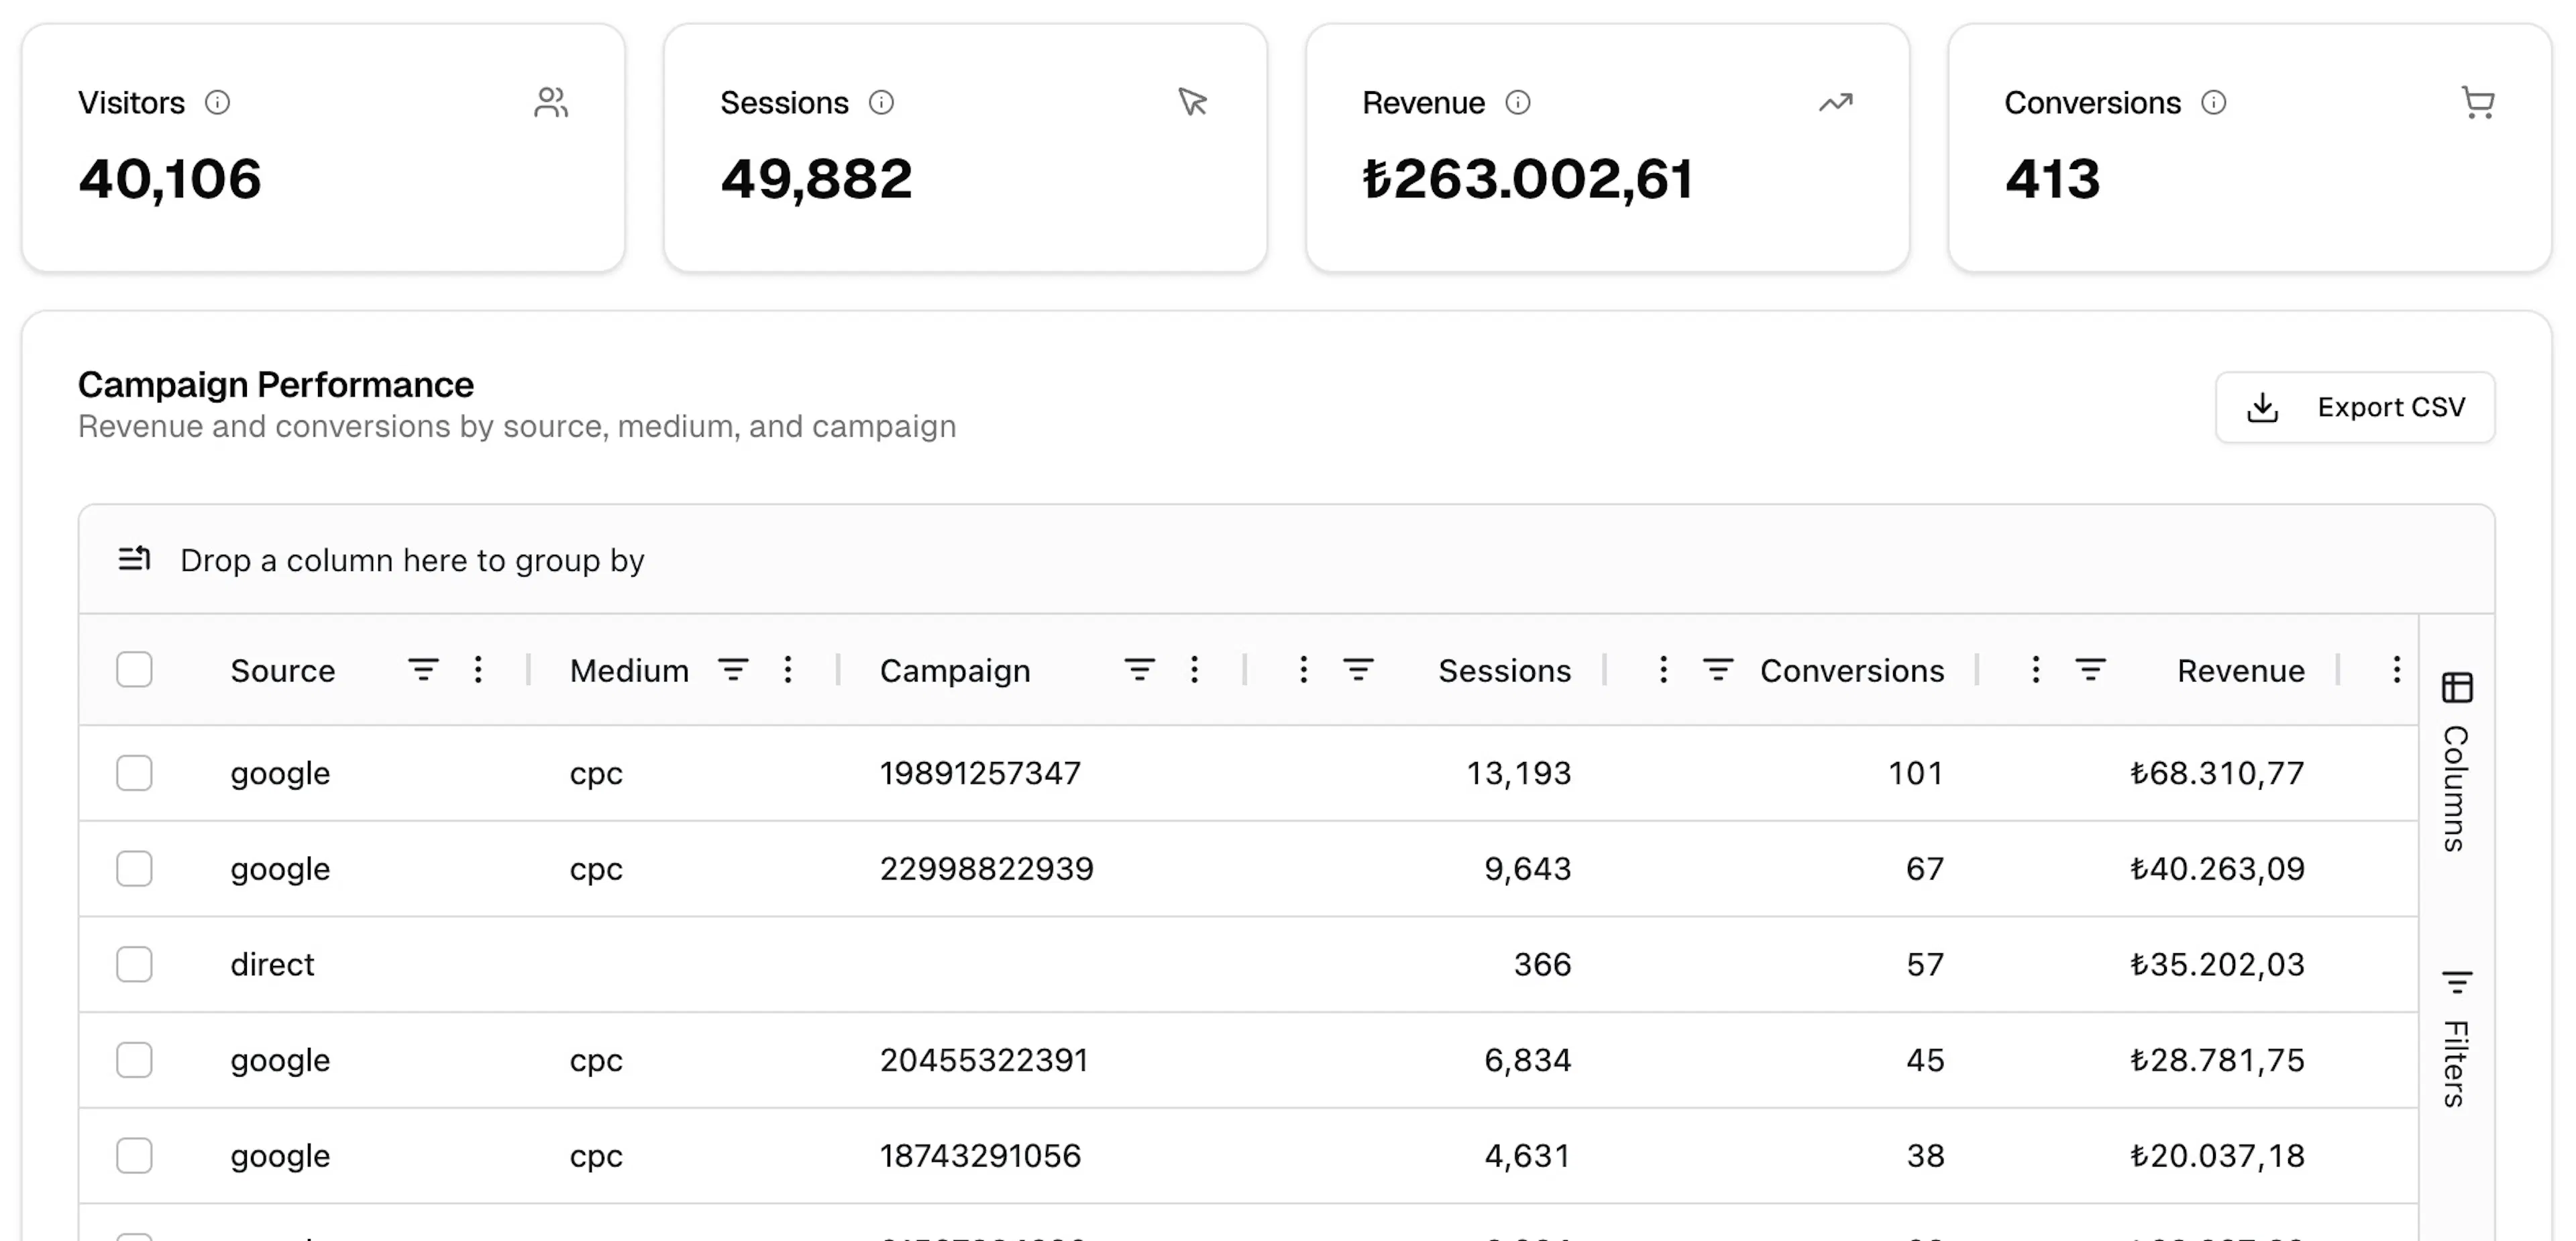
Campaign Performance table
The Campaign Performance table — "Revenue and conversions by source, medium, and campaign" — lists every traffic source combination with its results.
Columns
| Column | Description |
|---|---|
| Source | Traffic source (e.g. google, direct, instagram) |
| Medium | Traffic medium (e.g. cpc, story) |
| Campaign | Campaign identifier |
| Sessions | Sessions attributed to this source/medium/campaign |
| Conversions | Conversion events attributed |
| Revenue | Revenue attributed |
| Conversion Rate | Conversions ÷ sessions |
Hardal uses session-based attribution — conversions are attributed to the source that brought the session in which the conversion occurred.
Use the Columns panel on the right edge to show or hide fields, the Filters panel to narrow results, and Export CSV to download the table.
Configuring conversions and channel scoring
Conversion events and channel scoring weights are configured in Settings → Report Settings. Each key-value pair controls a specific aspect of attribution behaviour, such as Campaign.Channel.Score.Direct or Campaign.Channel.Score.PaidSearch.
To change which event counts as a conversion or how channels are weighted, go to Settings → Report Settings and edit or add the relevant keys.
Campaigns report setup
Make sure your conversion events and UTM parameters are set up correctly for accurate attribution