Items
Analyse product performance — conversion sessions, items sold, and revenue — by name, SKU, brand, and category.
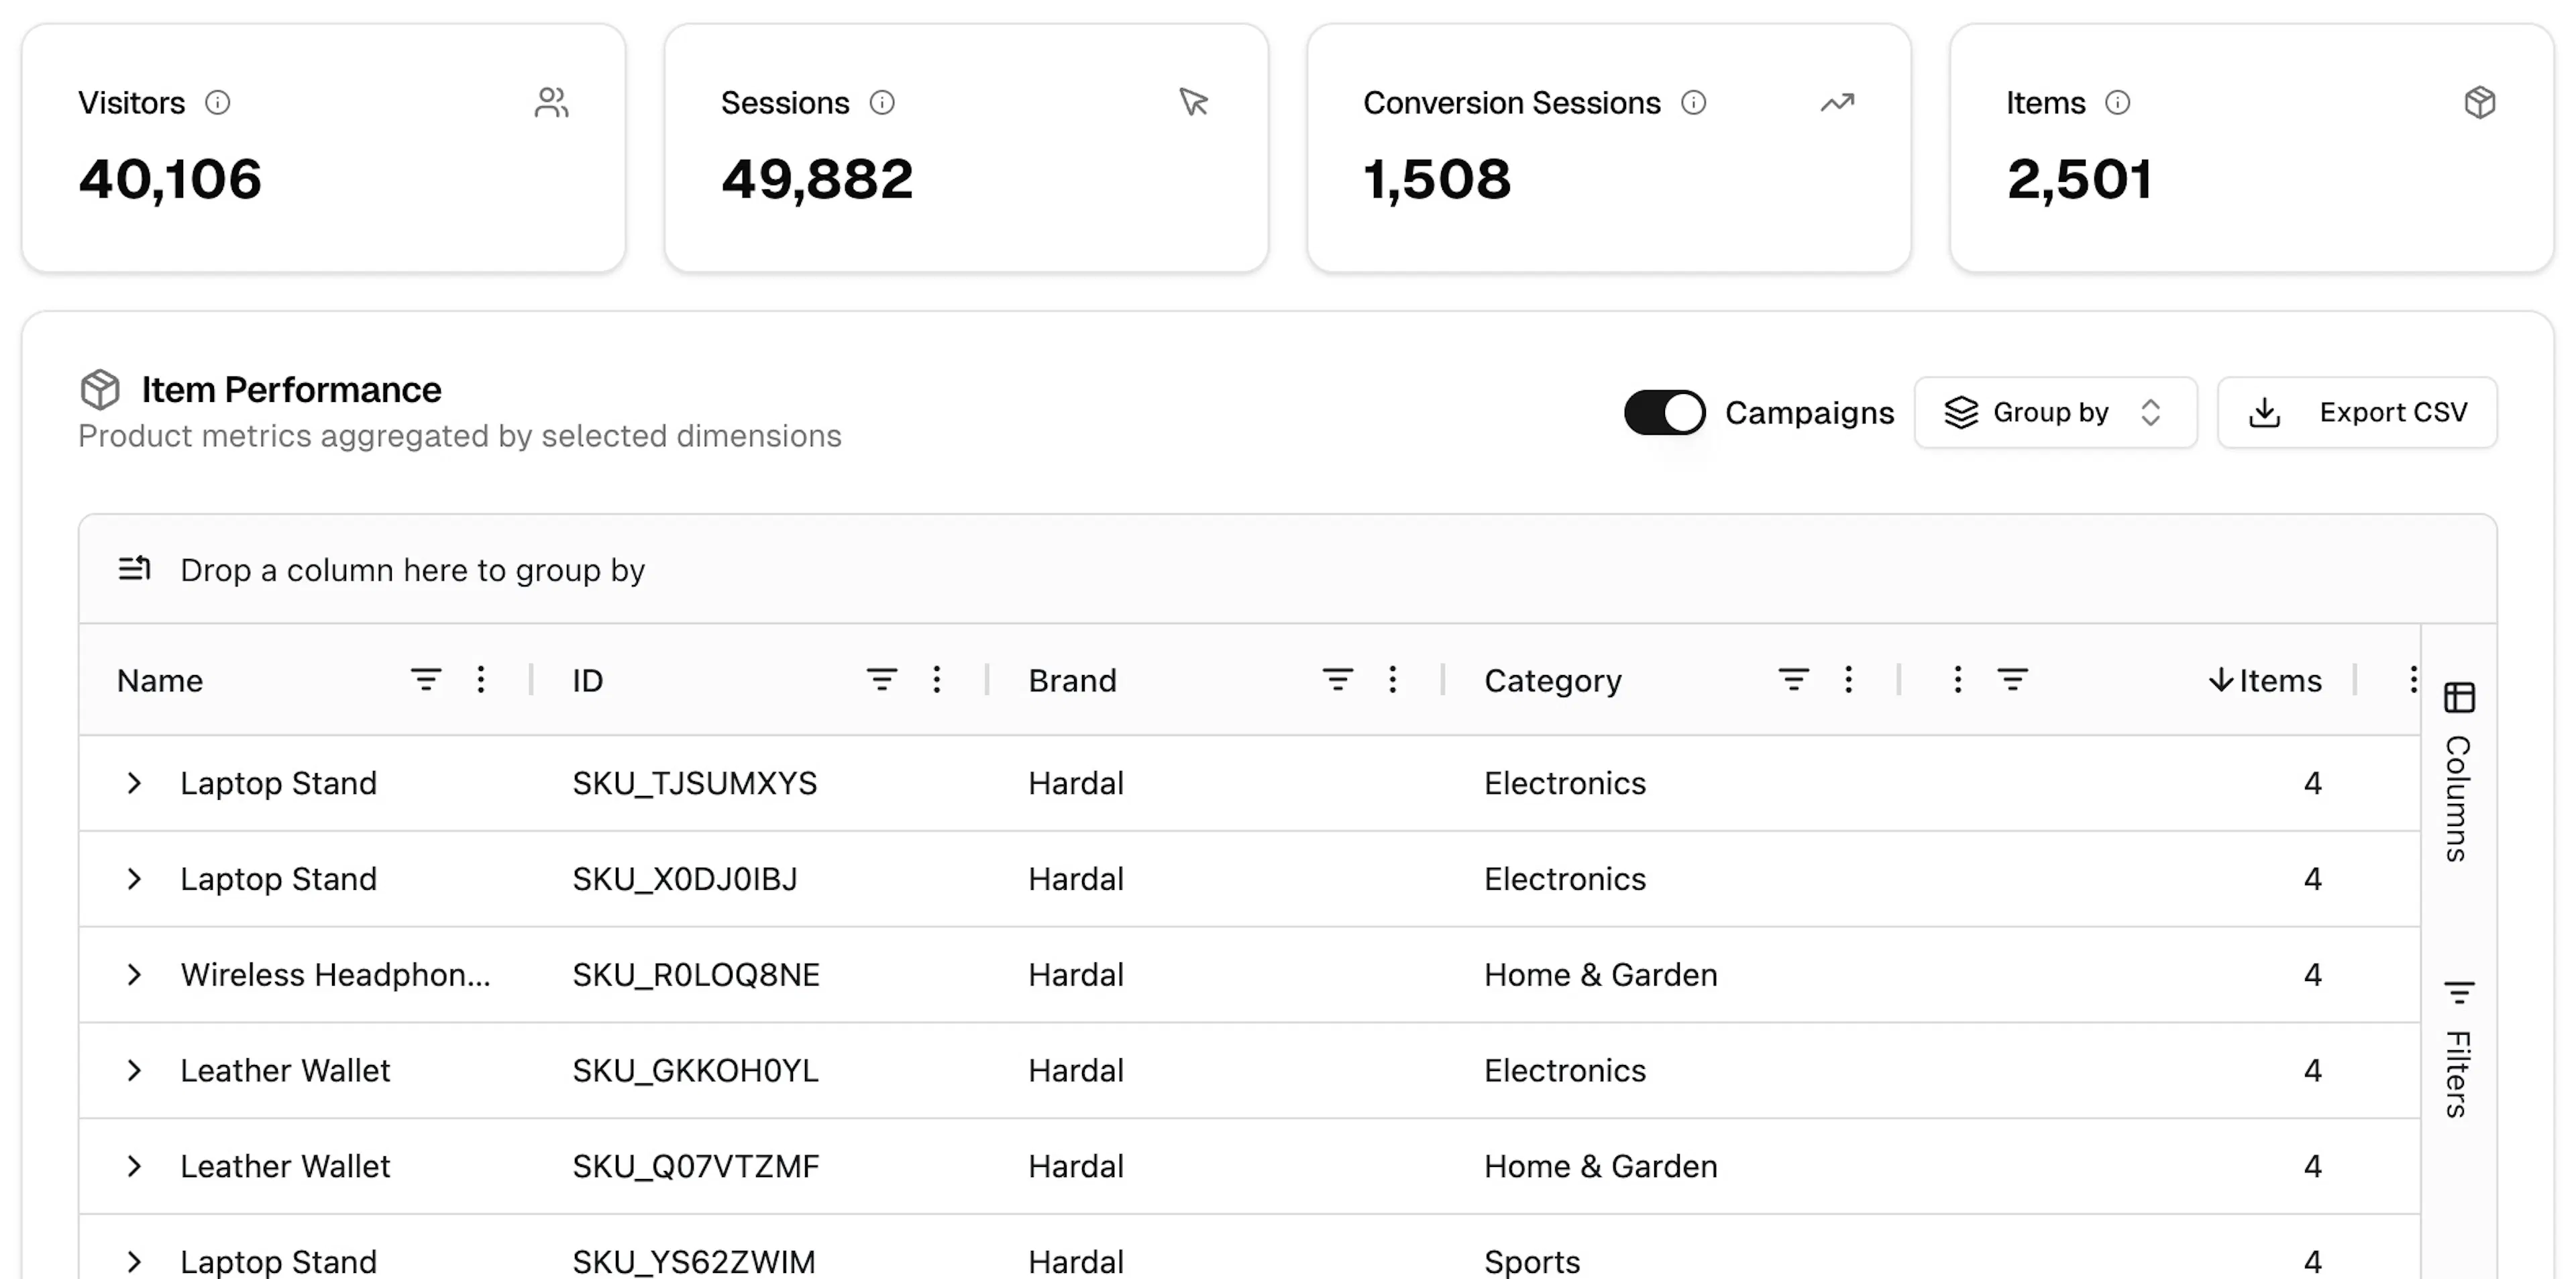
The Items page shows how individual products are performing. Use it to identify top-selling items, compare categories, and understand which products drive the most revenue. Navigate to it via Analytics → Items.
Toolbar
-
Date range — Today, Yesterday, Last 7 days, Last 30 days, or Custom Range
-
Compare to — toggle to enable period-over-period comparison
Summary metrics
Four cards show totals for the selected period:
| Metric | Description |
|---|---|
| Visitors | Unique visitors |
| Sessions | Total sessions |
| Conversion Sessions | Sessions that included at least one item conversion event |
| Items | Total items involved in conversion events |
Item Performance table
The Item Performance table — "Product metrics aggregated by selected dimensions" — lists each product with its performance data.
Controls
-
Campaigns toggle — when enabled, overlays campaign attribution data on the product rows
-
Group by — change how rows are grouped (e.g. by brand or category instead of individual SKU)
-
Export CSV — download the current table
Drag a column header to the top bar to group by that dimension.
Columns
| Column | Description |
|---|---|
| Name | Product name |
| ID | Product SKU or ID |
| Brand | Product brand |
| Category | Product category |
| Conversion Sessions | Sessions that converted on this product |
| Items | Total units involved in conversion events |
| Revenue | Total revenue attributed to this product |
Use the Filters panel on the right edge to narrow results by dimension.
Items data is populated by view_item, add_to_cart, begin_checkout, and purchase events that include item parameters. Make sure your tracking implementation sends item arrays with these events.
Items report setup
See the full item parameter reference and common setup issues