Funnel
Visualise drop-off across a multi-step conversion flow and break down results by source, device, and more.
The Funnel page shows how many sessions complete each step of your conversion flow and where they drop off. Navigate to it via Analytics → Funnel.
Toolbar
-
Date range — Today, Yesterday, Last 7 days, Last 30 days, or Custom Range
-
Compare to — toggle to enable period-over-period comparison
-
Filters: + Add — apply dimension filters (e.g. limit to a specific source or country)
Summary metrics
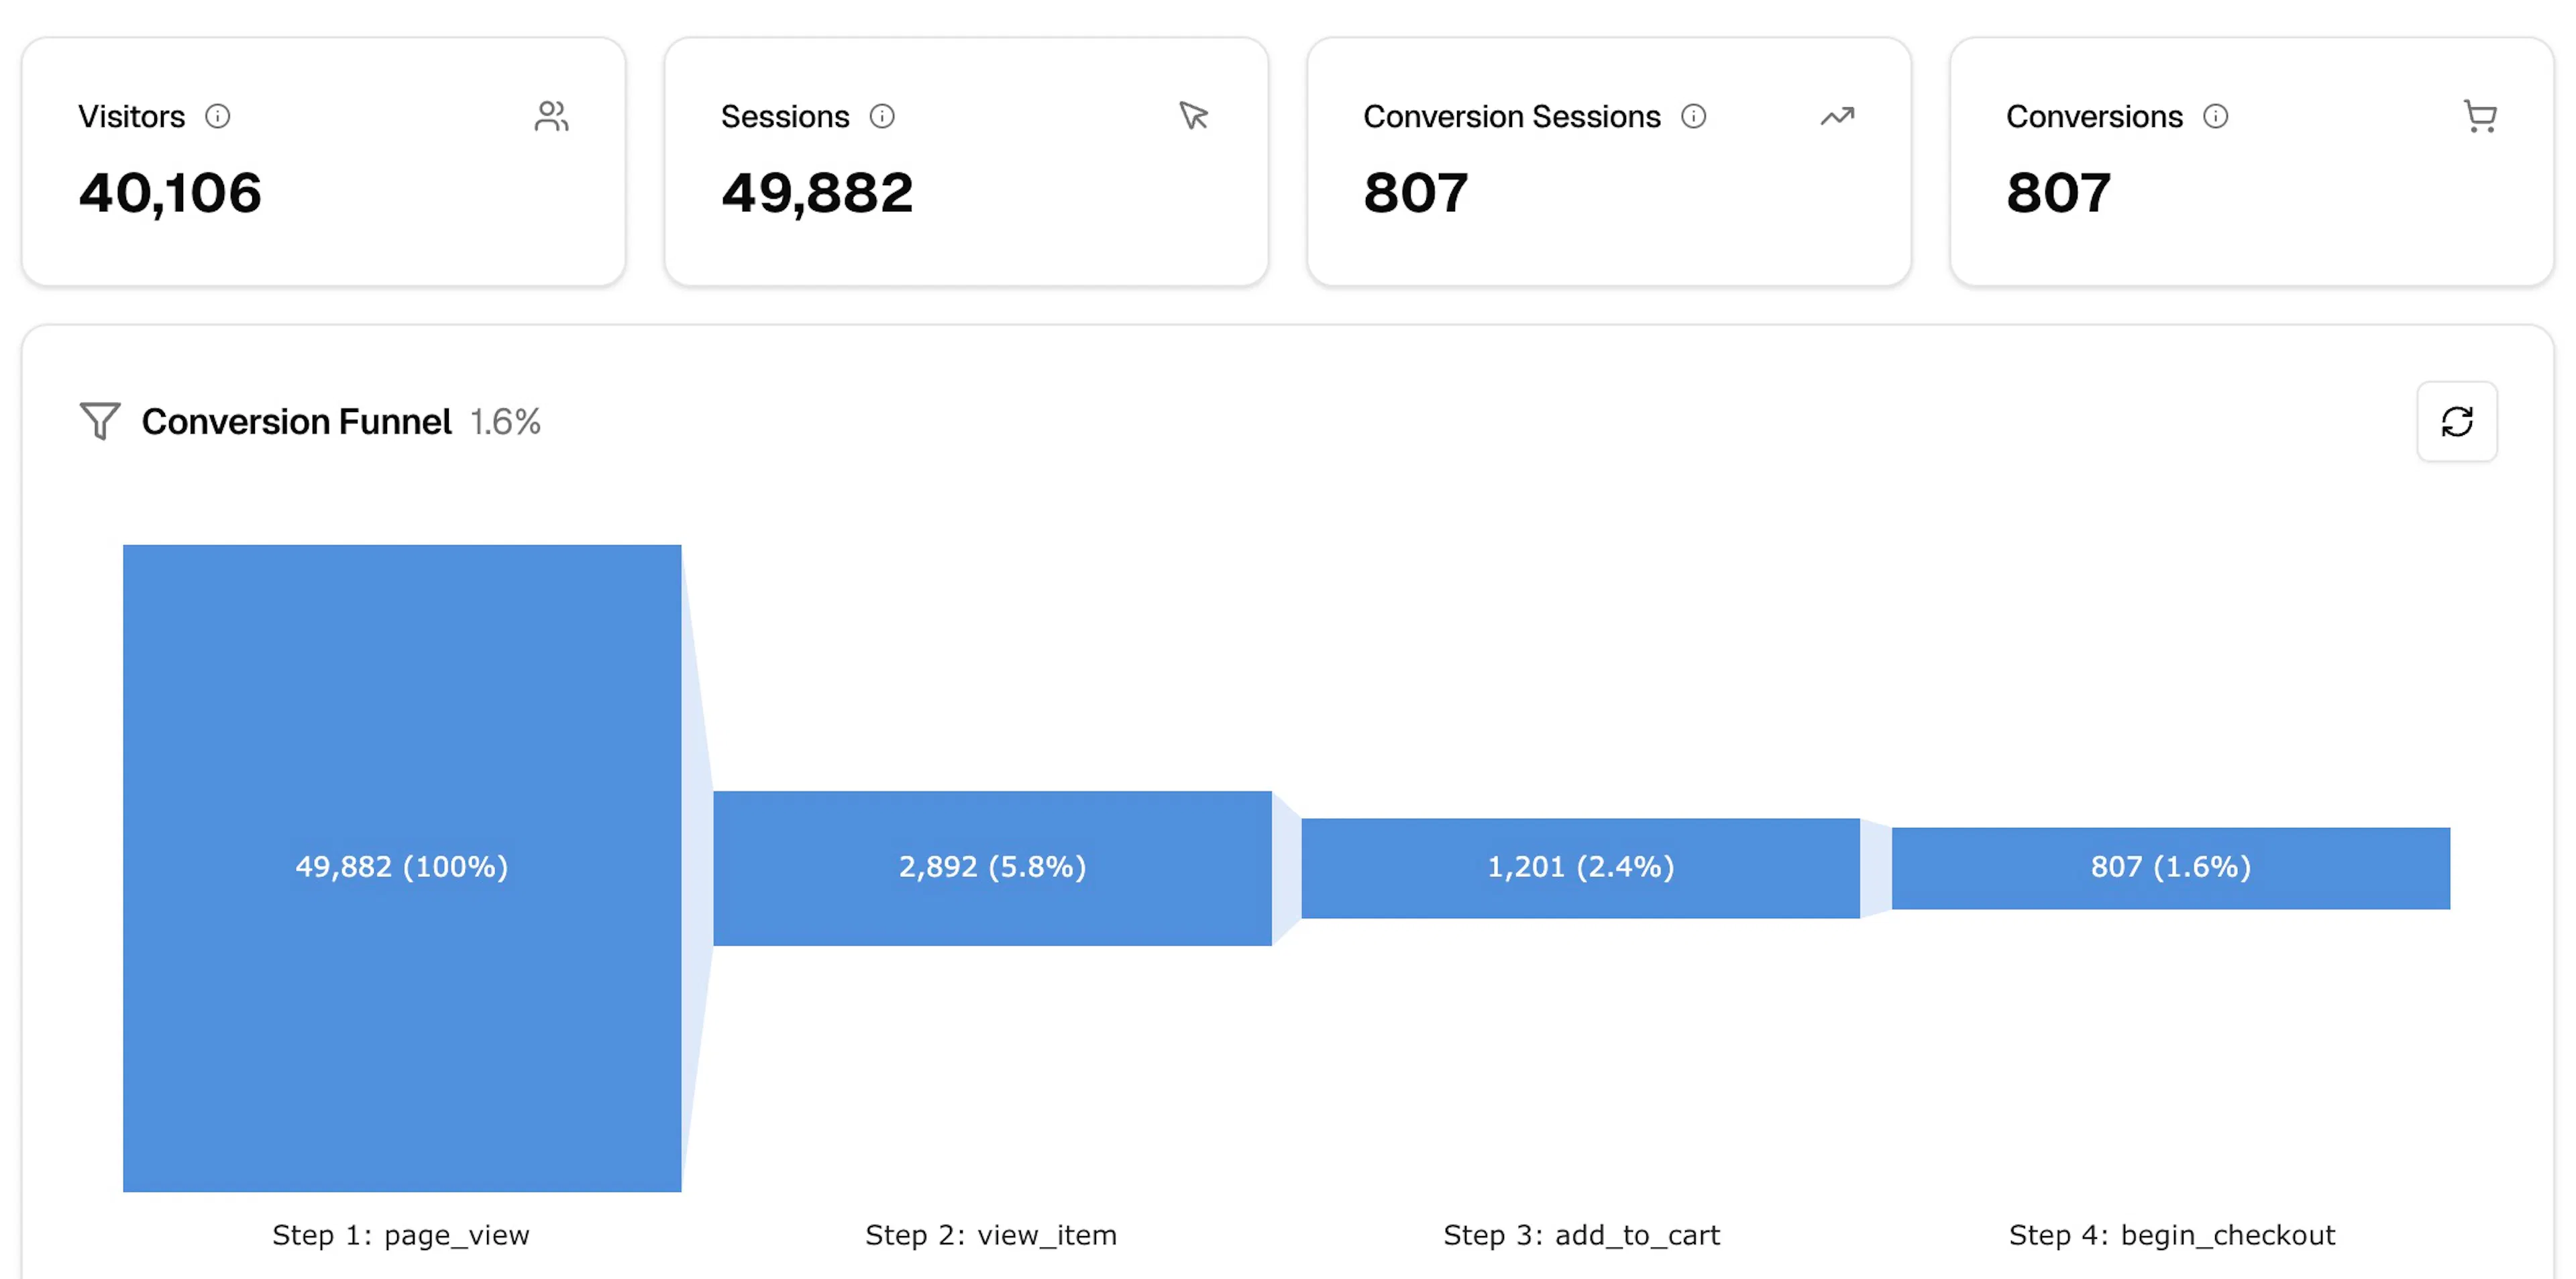
Four cards show totals for the selected period:
| Metric | Description |
|---|---|
| Visitors | Unique visitors |
| Sessions | Total sessions entering the funnel |
| Conversion Sessions | Sessions that completed all funnel steps |
| Conversions | Total conversion events |
Conversion Funnel chart
The main chart is a horizontal bar chart. Each step is represented as a bar — the height of the bar is proportional to the number of sessions that reached that step, scaled so differences across steps are easy to read.
The overall conversion rate appears next to the Conversion Funnel heading (e.g. 1.4%).
Each bar is labelled with the step name and shows the session count and percentage relative to the first step. The default funnel for an ecommerce signal runs through:
-
page_view— all sessions -
view_item— sessions that viewed a product -
add_to_cart— sessions that added to cart -
begin_checkout— sessions that started checkout
Hover over a bar to see the drop-off rate from the previous step.
Breakdown table
Below the chart, a Breakdown by dropdown lets you segment the funnel data. Available options:
-
No breakdown
-
Source
-
Medium
-
Campaign
-
Device
-
Browser
-
Operating System
-
Country
-
City
When a breakdown is selected, the table splits each step's session count by the chosen dimension, making it easy to compare funnel performance across segments.
The table rows are Sessions (count per step) and Drop-off (percentage of sessions lost between steps). Click CSV to export.
Funnel report setup
See which events are required for each funnel step and how to track them correctly