Events
Browse and inspect every event your signal receives, with filters, timeline charts, and full payload details.
The Events page shows every event your signal has received. Use it to verify that events are firing correctly, inspect payloads, and export raw data. Navigate to it via Analytics → Events.
Toolbar
-
Date range — Today, Yesterday, Last 7 days, Last 30 days, or Custom Range
-
All Events — filter to a specific event type or view all event types together
-
Refresh — reload the data manually
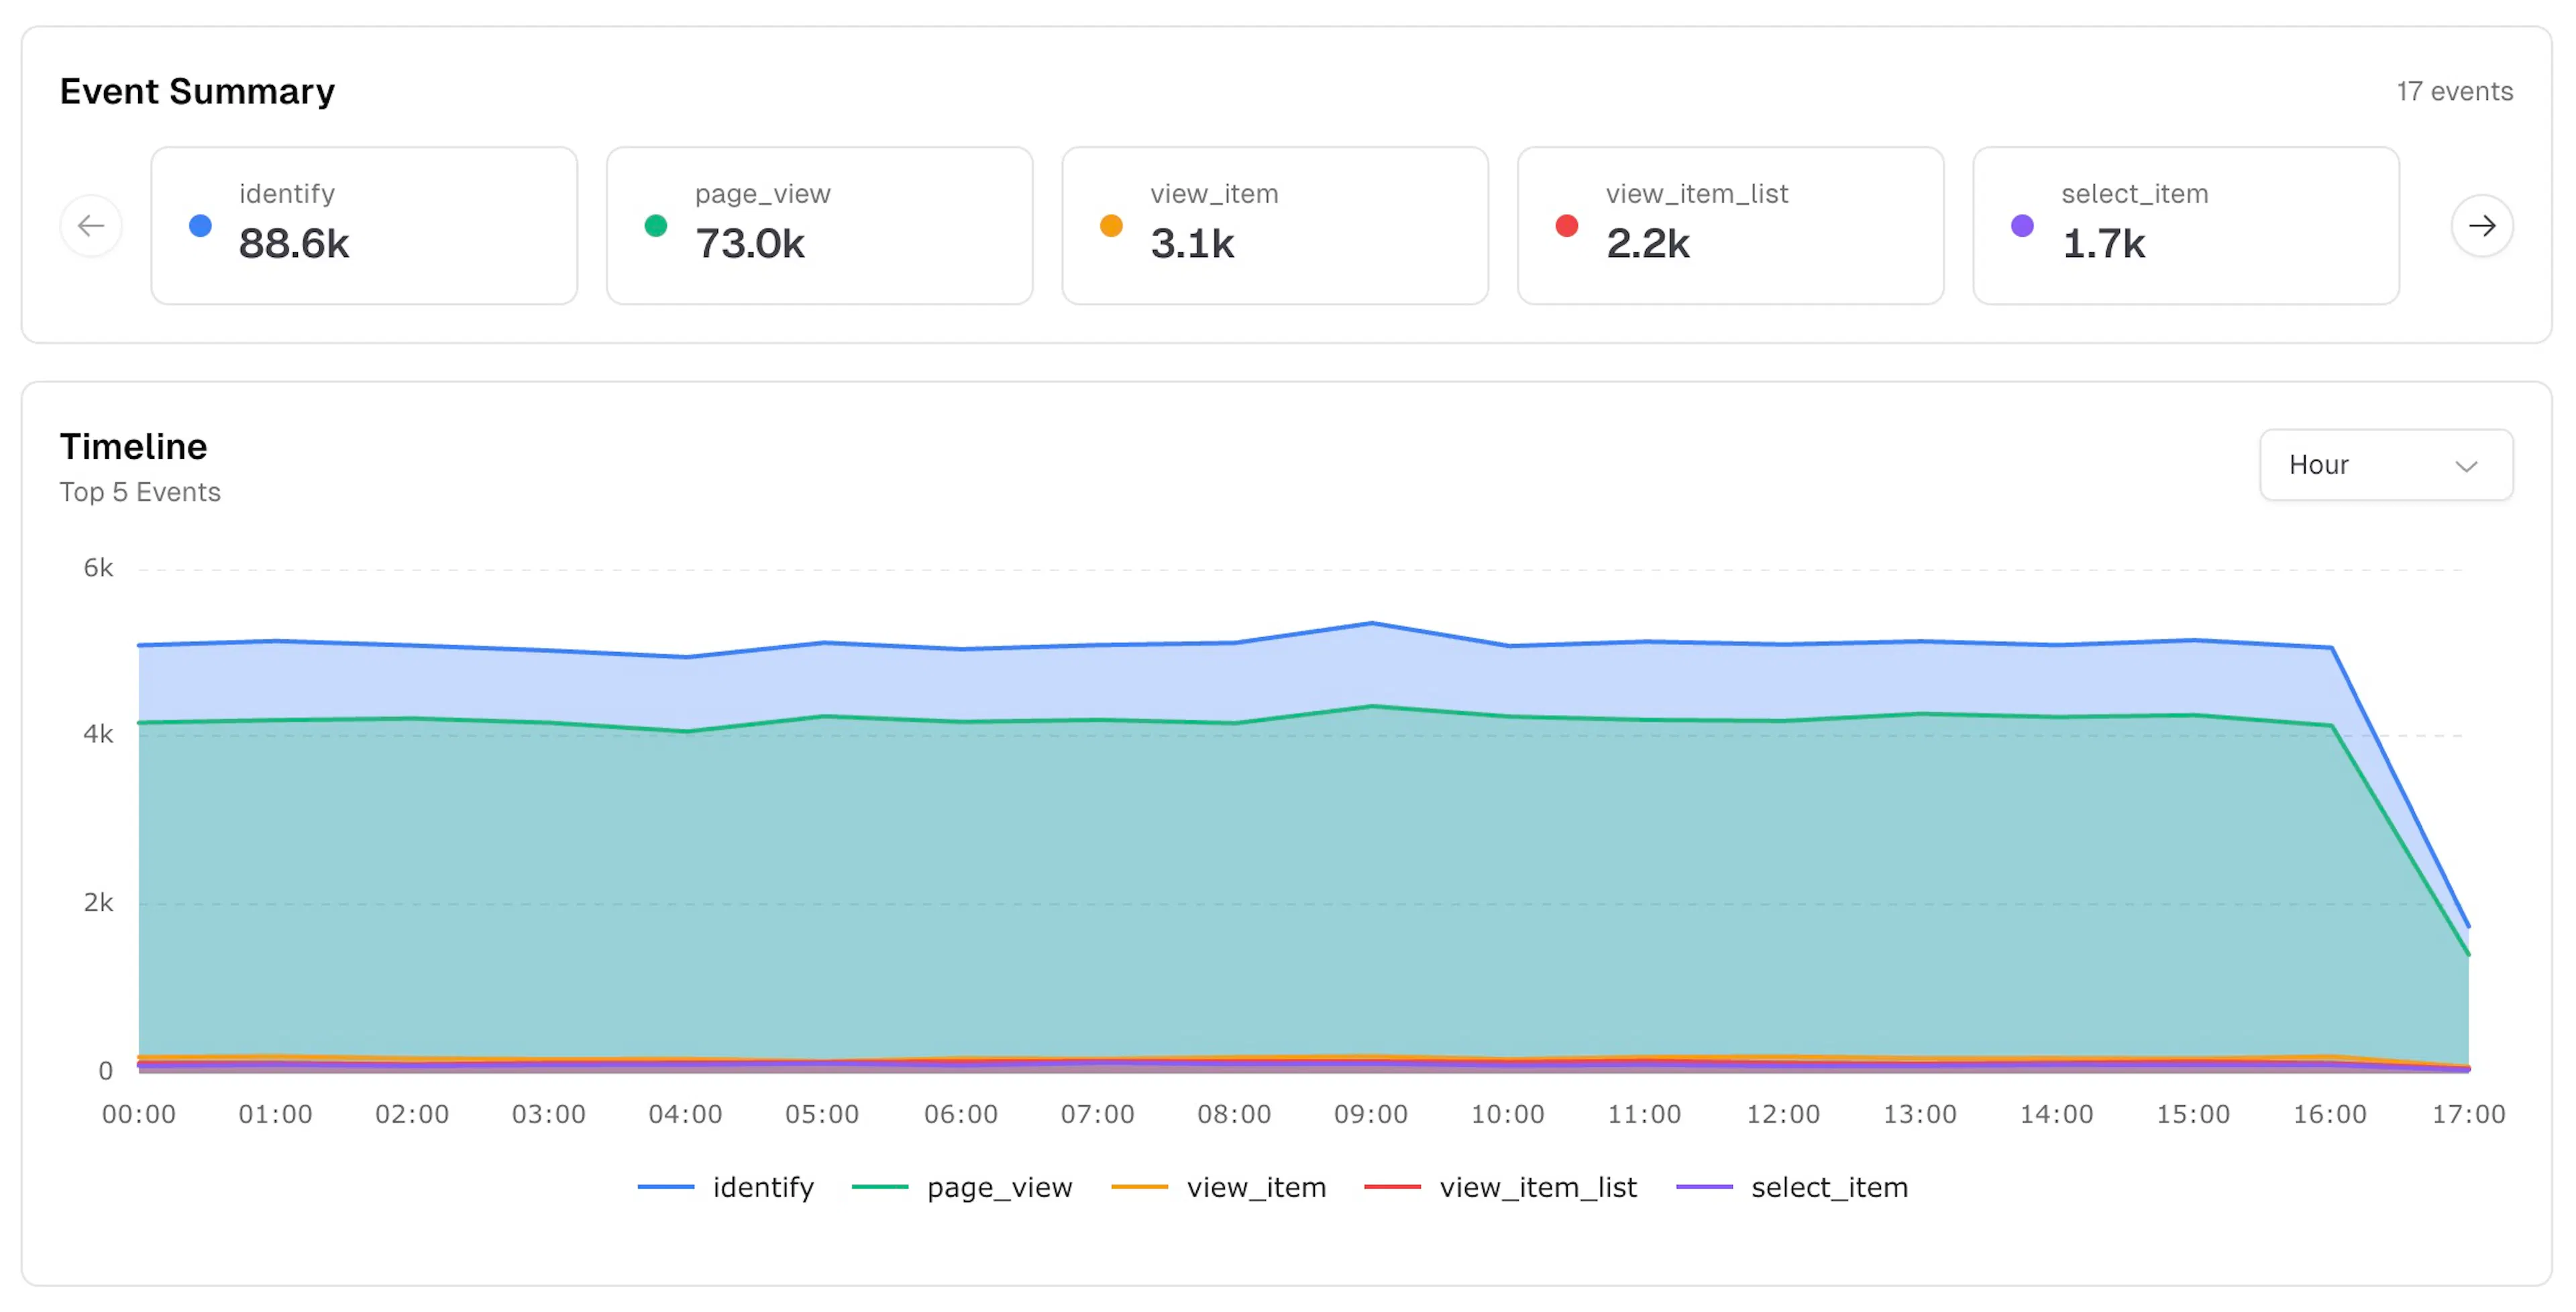
Event Summary
A horizontally scrollable row of color-coded cards, one per event type, sorted by volume. Each card shows the event name and total count for the selected period. The header shows the total number of distinct event types. Use the arrow buttons to scroll through all event types.
Timeline
An area chart showing the top 5 events by volume over time. Use the Hour dropdown to change the time granularity.
Custom Event Logs
A detailed log of every individual event. Drag a column header to the top bar to group by that dimension.
Columns
| Column | Description |
|---|---|
| Timestamp | Date and time the event was received |
| Event | Event name (e.g. page_view, identify) |
| Page Path | The path where the event fired |
| Device Info | Flag, browser, OS, and device type icons |
| Session ID | The session this event belongs to |
Filtering and exporting
-
Click the Filters panel on the right edge to add filters by event type or other dimensions
-
Click the Columns panel to show or hide table columns
-
Click CSV to download the current result set
The table is paginated. Use the Page Size dropdown to control rows per page.
Event detail panel
Click any row to open a slide-out panel with the full event payload, organised into four sections:
Event Details
-
Timestamp
-
Session ID
-
Hostname
-
Path (including any UTM parameters)
Device & Location
-
Browser
-
Operating System
-
Device type
-
Location (country)
Attribution
-
Source
-
Medium
-
Campaign
-
Channel
Parameters
All custom fields sent with the event (e.g. firstName, lastName, customerId, email, city, country, state, zip, phone, gender).